

Notes and picture credits are presented in the final part of this series.
This installment includes content that sensitive readers may prefer to avoid.
May 31st, 1889: Failure of the South Fork Dam
While Pitcairn’s train trundled east, John Parke rode back to Lake Conemaugh and the South Fork Dam. There, he learned that Col. Unger had changed his mind about the fish screens and had reassigned laborers to remove both the screens and the log boom to increase the discharge of the spillway. The laborers found, however, that the screens were now so jammed by the water and debris ferociously pouring into the spillway that they could budge neither the screens nor the boom. Parke also saw that the lake had officially begun overtopping the dam during his absence. He likely knew from his studies at Penn that this represented the worst danger possible during an emergency at an earth dam (Francis et al. 1891, McCullough 1968).
The precise mechanisms by which earth dams or embankments fail by overtopping depend on whether the soils comprising them are more granular or more cohesive. Both types of material were used to build and rebuild the structure eventually known as the South Fork Dam. However, the overtopping failure at the dam as observed by eyewitnesses on May 31, 1889, appears to have resembled more closely those of structures built of cohesive soils than those of structures built of granular soils. Crest lowering is also, generally, more sudden during overtopping failures for dams or embankments built of cohesive soils than for those built of granular soils. Per eyewitness accounts, the final failure of the South Fork Dam was abrupt, swift, and dramatic. Finally, 21st-century geotechnical engineers recognize that even a low fraction of cohesive materials in a soil can cause it to behave as though it were composed mostly or entirely of cohesive material (Francis et al. 1891, Hanson et al. 2005, McCullough 1968, USACE 2017, Visser 1998).
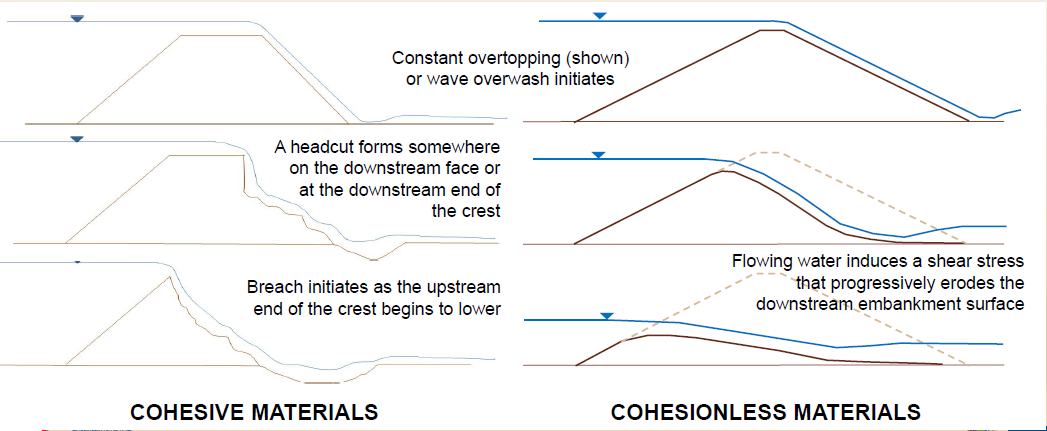
Source: USACE (2017).
The development of geotechnical engineering as a discipline still lay decades away as of 1889. John Parke’s observations, however, align well with 21st-century understandings of overtopping failures of dams and embankments. Parke noted that Lake Conemaugh was now roughly 7.4 feet deeper than usual. He also observed that the overtopping depth of lake water pouring over the South Fork Dam was roughly 1 foot deep and was concentrated at the sag in the center of the dam. Lastly, Parke noticed that the water was steadily forming rills and gullies in the downstream face of the structure. Current dam engineers refer to this formation as surface detachment, and it typically represents the first phase of overtopping failure for dams or embankments built of cohesive soil (Francis et al. 1891, Hanson et al. 2005, McCullough 1968).
Parke also believed, though, that the situation at Lake Conemaugh early that afternoon held glimmers of hope. He noted that the emergency spillway, raging with water, was thus clearly functioning as planned, as indicated by how the depth of overtopping was holding steady. Parke concluded from these observations that the lake had reached its peak depth and might soon begin falling. Eyewitnesses both near the lake and in the valley below would later confirm that, during the storm of May 30-31, the water level of the Little Conemaugh River and its tributaries had peaked between noon and 1 PM on May 31st. The 21st-century UPJ research team cited times to peak discharge on the river from later storms as further evidence to support Parke’s conclusion (Coleman 2018, Francis et al. 1891, McCullough 1968).
John Parke decided, based on the fairly constant level of Lake Conemaugh, to set aside his last-ditch plan to keep the South Fork Dam from failing. Parke, per his later recollection of the afternoon, had been considering whether the crews might excavate a last-ditch spillway through the dam itself if the lake rose further. He had wondered whether such a measure, while certainly drastic, might still greatly reduce damage compared to the destruction that would surely ensue if the dam breached. Yet Parke knew that only Club President Unger had the authority to make that decision. He also realized that the quasi-static lake level did not support the necessity of taking such a dramatic action (Coleman 2018, Francis et al. 1891, McCullough 1968).
Parke certainly believed that the situation was improving and, even had he thought otherwise, could scarcely have done more to protect the South Fork Dam. He was also undoubtedly exhausted from what had been, to put it mildly, a stressful morning. Parke thus returned to the Clubhouse and ate lunch. However, his seemingly reasonable confidence that the dam might survive the storm was tragically misplaced. 21st-century dam engineers have determined through field studies that sustained overflow even 1 foot deep can substantially increase the probability of an overtopping failure (Coleman 2018, Hanson et al. 2005, Francis et al. 1891, McCullough 1968).
John Parke returned to the main spillway after eating to find his hopes dashed and the situation grimmer than ever. While he had eaten, the overtopping waters of Lake Conemaugh had carved a hole 10 feet wide and 4 feet deep into the downstream face of the South Fork Dam. 21st-century geotechnical engineers refer to such holes as headcuts, the formation of which represents the second typical step in the overtopping failure of embankments built of cohesive soils. Parke, Unger, the laborers, and the bystanders watched with mounting fear as the headcut progressed upstream through the dam toward the lake in a process current dam engineers call headcut migration (Francis et al. 1891, Hanson et al. 2005, McCullough 1968, USACE 2017).
Field tests indicate that earth dams or embankments compacted near the optimum dry density and moisture content of the soil comprising them can better resist headcut migration during overtopping by several orders of magnitude than structures compacted less carefully. Therefore, the impact of Benjamin Ruff’s decision during the reconstruction of the South Fork Dam to have his crew lackadaisically dump fill material into the 1862 breach cannot be overstated. The crew’s failure to puddle or even properly compact this fill surely accelerated the headcut migration that onlookers observed at the dam in its final minutes. The headcut reached Lake Conemaugh at around 2:50 PM, thereby breaching the dam. At that point, the dam was no longer impounding the lake and had therefore, by definition, failed. Moments later, however, the entire center of the dam appeared to give way, and a torrent of water rushed through it. Eyewitnesses remembered this catastrophic final breach far more vividly than they recalled the initial breach which had technically signified the failure of the dam (Coleman 2018, Hanson et al. 2005).

Source: Hanson et al. (2005).
Final Breach of the South Fork Dam: Possible Geotechnical Mechanisms
The precise geotechnical nature of the final breach of the South Fork Dam appears never to have been formally investigated or even discussed at length. Most histories of the Johnstown Flood of 1889 focus mainly on its consequences, not its mechanics. The UPJ research study on the hydraulics of the dam failure mentioned its geotechnical aspects only briefly. Clearly, overtopping caused the initial breach. However, several experienced dam engineers have noted that such failures of dams or embankments usually, in their experience, release water rather gradually from impounded reservoirs or waterways. By contrast, those who saw the final breach at Lake Conemaugh uniformly noted that, afterwards, the lake furiously surged through the dam remnants. The overall dam failure was thus clearly more than a straightforward case of overtopping. Additional geotechnical mechanisms such as global instability and/or static liquefaction most likely caused the final breach (Coleman 2018, McCullough 1968).
Global or slope instability is unfortunately widespread in geotechnical engineering and can occur in soil of any classification. Methods for assessing slope stability commonly assume circular failure surfaces, which are often fairly accurate compared to observed failure surfaces. Global instability failures often come to completion rapidly, and those at the dam noted the final breach was remarkably swift and loud. One bystander recalled that the air displaced by the onrushing waters of Lake Conemaugh toppled mature trees and sent rip-rap boulders flying. Other observers, including Col. Unger and John Parke, commented that the final breach had appeared more like a pushing away of the center of the dam than like a decisive breaking of it. These accounts suggest that global instability was involved to some extent in the final failure of the dam. Several experienced dam engineers have given credence to this hypothesis (Kaktins et al. 2013, McCullough 1968).
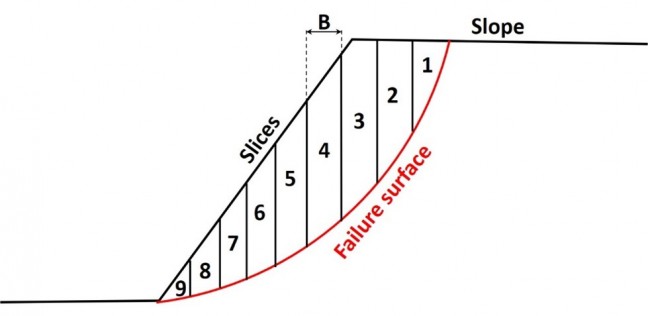
Source: Geoengineer (2021).
Source: Braun Intertech (2016).
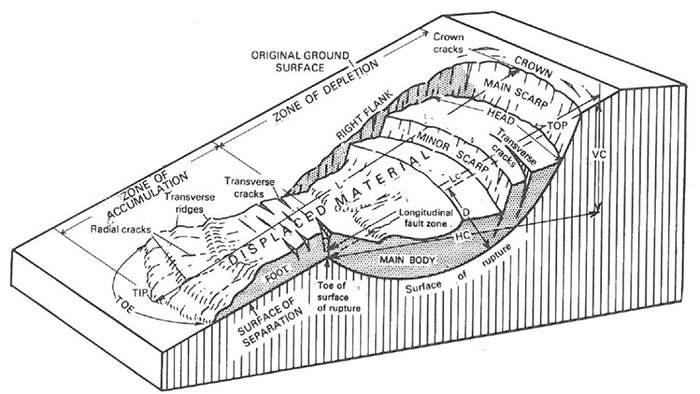
Static liquefaction occurs when excess pore water pressure builds up in loose, granular soil, which reduces its shear strength. Such a build-up may happen when loads are imposed on the soil without allowing adequate time for drainage or when internal seepage, such as piping, changes the water content of the soil. Eventually, a triggering event occurs, causing a shear failure in the soil. Such events may involve a rapid rise in adjacent water levels (potentially also causing overtopping) or a loss of confining stresses in the soil due to lateral strain. While undrained clays cannot undergo static liquefaction, they may exacerbate it by amplifying lateral strains in overlying granular soils during triggering events. Static liquefaction is a common cause of dam failures, especially among those impounding mine tailings, or waste products. Many dam failures due to static liquefaction have also involved global instability (ASDSO 2022 C, Kaktins et al. 2013, KCB 2018, Rodriguez Pacheco 2018).

Source: Warburton et al. (2020).
Source: Warburton et al. (2020).
The mechanisms of overtopping, global instability, and static liquefaction are, fundamentally, constructs generated by geotechnical engineers. Such mechanisms quantify and simplify the complex process of designing structures such as dams against certain general types of geotechnical failure. However, actual failures are usually more complex than any single mechanism. Nevertheless, the mechanisms remain valuable tools for geotechnical engineers to use together with experiential judgment in generating a fairly accurate hypothesis, if not an exact explanation, for how a failure unfolded. The complete nature of the failure of the South Fork Dam may therefore be hypothesized. Available evidence suggests that, after Lake Conemaugh had initially breached the dam via overtopping, a combination of global instability, static liquefaction, or both mechanisms caused the final, massive breach seen by eyewitnesses.
May 31st, 1889: The Flood Begins
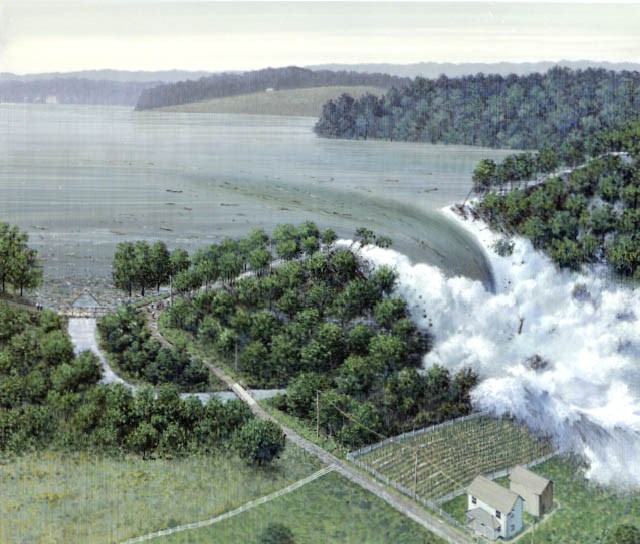
First-hand accounts of the final breach of the South Fork Dam confirm how astonishing a sight it was. John Parke recalled that “trees growing on the outer face of the dam were carried away like straws”. Per his account, the outflow from Lake Conemaugh was so torrential that a V-shaped notch formed in the surface of the lake and extended about 10 feet deep and about 150 feet upstream from the dam remnants. The remnants had effectively become a massive weir (Francis et al. 1891).
Source: NPS (2022 D).
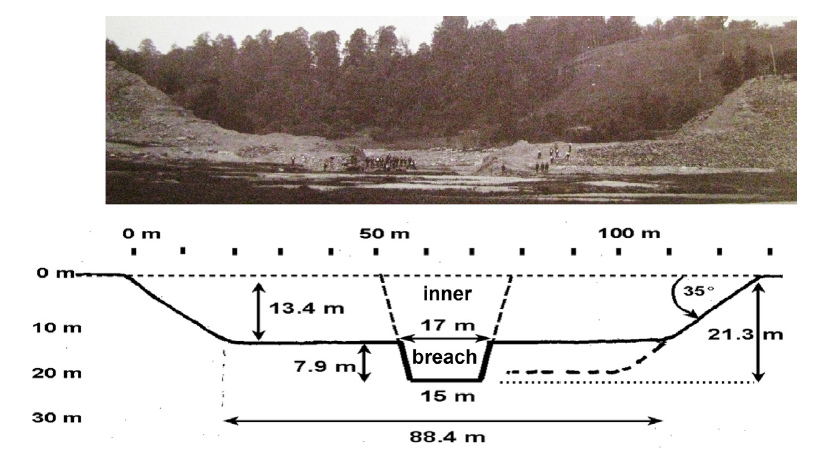
UPJ researchers determined that the geometry of the final breach consisted of a large, upside-down trapezoid stacked atop another, smaller upside-down trapezoid almost exactly in the center of the former South Fork Dam. The upper trapezoid measured about 420 feet along its longer base, about 290 feet along its shorter base, and about 44 feet high. The lower trapezoid measured about 56 feet along its longer base, about 49 feet along its shorter base, and about 26 feet high. The UPJ team estimated using this geometry that Lake Conemaugh most likely raged through the final breach at a peak discharge rate between 250,000 and 350,000 CFS. The researchers further estimated that the lake took at least 65 minutes to drain 44 feet, i.e., to the common base of the two trapezoids. Put differently, the lake dropped at an astounding average rate of 8 inches per minute for over an hour after the final breach (Coleman 2018).
Source: Coleman et al. (2016).
The final breach of the South Fork Dam turned the careful calculations and judgments of the civil engineers of the Main Line of Public Works grotesquely upside down. Decades earlier, the drop of about 450 feet from the surface of the old Western Reservoir to Johnstown had given the operators of the Main Line plenty of elevation head for the refilling of canals during hot summers. Now, however, the altitude difference gave the swollen waters from the former Lake Conemaugh unbridled energy with which to destroy the entire valley of the Little Conemaugh River. The eyewitnesses at the dam remnants watched, stunned, as the waters of the draining lake rushed with slowly ebbing ferocity through the final breach. Soon, their families, friends, and fellow citizens along the Little Conemaugh River began learning of the dam failure in the worst way possible (Coleman 2018, McCullough 1968).
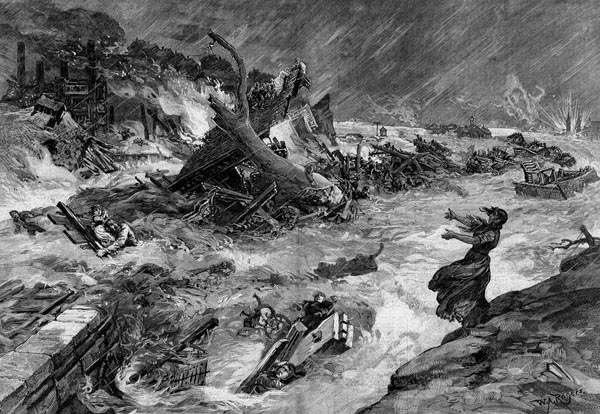
The Johnstown Flood of 1889 can perhaps be viewed most effectively by connecting technical concepts from civil engineering to the terrifying reality that the frightened residents of the previously ordinary towns of the valley faced as the flood rampaged along the Little Conemaugh River. Per Bernoulli’s Principle, the downhill journey of the wave converted its elevation head into pressure and velocity head components, minus energy losses. On the ground, though, this conversion played out in a much more harrowing way. The pressure head of the flood appeared to locals as an oncoming wall of water that not all, sadly, escaped. The velocity head of the wave presented itself to them in the way the seething, speeding torrent swept them up and forced them to frantically struggle to stay afloat. Perhaps worst of all, the energy losses of the flood wave translated for many citizens to the bone-chilling sight of a house or a locomotive being hurtled straight at them. Even the name of the “Johnstown Flood” fails to convey the horrifying, destructive cataract that the residents saw thundering down upon them that afternoon. To many, the wave probably appeared more like a tsunami (Coleman 2018, McCullough 1968).
The flood wave crashed through the valley of the Little Conemaugh River with the lethal efficiency of a PRR train on a timetable. The former contents of Lake Conemaugh became, as they sped downhill, a macabre hydraulics problem. The waters picked up or demolished nearly everything before them, including trees, railroad cars, boulders, houses, animals, and people. Those trapped atop the wave endured a dizzying, often fatal ride. However, unlike those caught by the wave, the riders at least stood a chance. Notably, the flood waters were repeatedly stopped temporarily by immense obstacles and enormous accumulations of debris. Inevitably, though, the overwhelming force of 16 million tons of falling water broke through the jam. The wave then continued onward in further lurches and stops with its deadly energy now renewed (Coleman 2018, McCullough 1968).
The terrible intermittent motion of the flood as it descended the valley of the Little Conemaugh River was matched in its horrific power only by its violent internal mechanics. The bottom of the wave picked up debris and slowed as the flood progressed. The relatively unimpeded top of the wave then sped over the bottom and crashed downward into the ground, which crushed or buried almost everything in its path. The flood wave thus flowed in a series of violent, high-energy loop-de-loops. Collectively, the external and internal hydrodynamics slowed the flood, which reached speeds of 40 miles per hour, to an average velocity of 11 miles per hour (Coleman 2018, McCullough 1968).
Source: Strayer and London (1964).
Overall, the flood wave traveled the 14 miles along the river valley from the dam remnants to Johnstown in about 1 hour and 15 minutes. The stories which came from the valley towns after the flood were depressingly, hideously similar. Many residents of South Fork, Mineral Point, East Conemaugh, and Woodvale, along with PRR passengers on several stranded trains, learned of the flood only by seeing the wave moments before it reached them and had just seconds to react. A few heard screeching warning whistles and scrambled to safety, but far too many were less fortunate. Thousands of ordinary Pennsylvanians whose lives had previously been uneventful now found themselves battling to stay afloat on a monstrous, powerful wave. The cacophony of the disaster – buildings shattering, furnaces and stoves exploding, victims screaming before being swept away or pulled under – is almost too awful to imagine (McCullough 1968).
Source: Hanna (2021).
May 31st, 1889: The Flood Reaches Johnstown
The citizens of Johnstown were cautiously but, in hindsight, unfoundedly optimistic about their situation as the clocks in the borough chimed 4 PM that day. They saw the sky getting lighter, the rain tapering off, and the flooded rivers starting to retreat. In short, the worst appeared to have passed. However, at 4:07 PM, the flood wave and everything it carried smashed into Johnstown unceremoniously. Most locals received little warning. Teenager Victor Heiser was untying horses in the family barn when he heard a low, eerie rumble that steadily grew louder and closer. Heiser’s parents frantically signaled from the second-floor window that he needed to reach higher ground. Heiser had just climbed onto the barn roof when the flood wave demolished both the house and the barn. Some residents got even less notice. Rev. H.L. Chapman learned of the flood only when a stranger riding out the waters atop a boxcar desperately leapt through his second-floor window to safety (McCullough 1968).
The flood wave played a monstrous game of chance with the residents of Johnstown as it tore the borough apart. Victor Heiser spent several minutes desperately hopping between floating roofs as he dodged trees, beams, and even – by seconds – a freight car. He noticed only midway through the deadly obstacle course that he was riding a torrent of water, not debris. Heiser miraculously survived the disaster, although his parents sadly perished. Schoolgirl Gertrude Quinn watched in horror as the raging flood waters swallowed her aunt, cousin, and family servant for eternity. She then rode a mattress downriver for miles until a rescuer swam out and literally threw her ashore; the rescuer also survived (McCullough 1968).

Source: Hopey (2022).
The final stories of the victims of the 1889 flood are, of course, lost to history. Other perspectives were lost when some survivors, like those of many tragedies, understandably kept to themselves the horrors they had endured. However, the verifiable stories of survivors of the flood remain astonishing, heartrending, and powerful. Rev. Chapman, Victor Heiser, and Gertrude Quinn, among many others, later shared their accounts through publications by either themselves or historians of the flood. Notably, only some survivors had to ride out the flood as Heiser and Quinn did. Many took refuge in their attics, as Rev. Chapman did with his wife, some friends and family, and the lucky boxcar rider. Others watched dumbfounded from the hillsides around town. Any tragedy, of course, is a deeply individual experience in which each survivor’s perspective is shaped by factors such as religious views and how family, friends, and neighbors fare. Yet Rev. Chapman likely spoke for many in Johnstown that day, regardless of faith or fate, when he wrote that, within his group, “None was afraid to meet God, but we all felt willing to put it off until a more propitious time” (McCullough 1968, Roker 2018).
Source: Glessner House (2014).
The human and technical aspects of the flood continued to play out together in a ghastly drama. Per eyewitnesses, the waters split into three smaller, still highly destructive waves after they struck Johnstown. The northern wave glanced off of Prospect Hill, north of the borough, which deflected the wave back toward downtown. The central wave surged through downtown, struck Westmont Hill west of town, and rebounded through downtown in a raging backwash. The southern wave surged up the valley of the Stony Creek River and inundated many who had erroneously thought they would be safe there from deluges on the Little Conemaugh River. A 21st-century geophysical study from UC Santa Cruz checked these historical accounts using a computer model based on the “tsunami ball method”, which uses energy packets to describe the behavior of tsunamis and landslides. The study produced a model which agreed well with firsthand accounts of the flood (McCullough 1968, Ward 2011).

Source: NPS (2021 C).
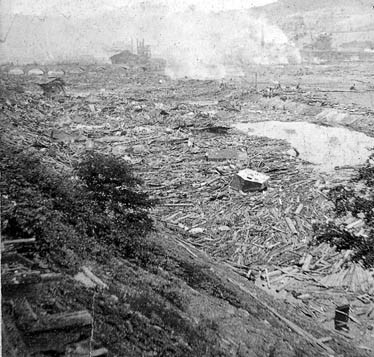
The three small waves soon poured back down the valleys, reunited, and smashed into the relatively new seven-arch masonry bridge, nicknamed the Stone Bridge, which carried the PRR over the Conemaugh River. By now, the flood wave had spent much of its energy destroying Johnstown, and the bridge held. However, the waters still had enough strength to crush the flood debris in a growing pile against the Stone Bridge. By 5 PM, the ruins covered over 60 acres, loomed higher than the bridge, and had dammed all seven arches of the structure. This formed a grisly temporary lake which drowned the remnants of Johnstown in 10 to 30 feet of debris-laden floodwater. The wreckage also held many animals and humans, some dead but many still alive (McCullough 1968, Strayer and London 1964).
Source: JAHA (2022 B).
The mounting water and debris eventually overwhelmed the railroad east of the Stone Bridge. Once the embankment yielded, the temporary lake at last began draining away from the pulverized ruins of Johnstown. The onrushing waters still badly damaged towns downstream of the bridge, but the structure certainly spared them to some extent. Yet things in Johnstown somehow got even worse. The debris heap at the Stone Bridge included many open-flame furnaces, heaters, stoves, and lamps, along with all kinds of flammable wreckage. By 6 PM, an inferno had begun, and it incinerated scores of flood survivors trapped in the detritus. Some local Civil War veterans later remarked that the night after the flood was the worst site they could remember, presumably including combat. Night finally fell over where Johnstown had stood that morning. At 10 PM, though, the blaze was still burning so intensely that one could read by its light (McCullough 1966, McCullough 1968).