
Preferred Design Procedure
The Federal Highway Administration (FHWA) has design guidance for this technology. The document is identified below:
| Publication Title | Publication Year | Publication Number | Available for Download |
|---|---|---|---|
| Geotechnical Engineering Circular No. 1 — Dynamic Compaction | 1995 | FHWA-SA-95-037 | Yes* |
*http://www.fhwa.dot.gov/engineering/geotech/library_listing.cfm
References
Boulanger, R.W. and Idriss, I.M. (2014). “CPT and SPT Based Liquefaction Triggering Procedures.” Department of Civil & Environmental Engineering, University of California at Davis, Davis, CA. Report No. UCD/CGM-14/01
Dumas, J.C. and Beaton N.F. (1992). “Dynamic compaction, Suggested guidelines for evaluating feasibility- for specifying- for controlling.” Canadian Geotechnical Conference Proceedings, p. 54-1-54-12.
Elias, V., Welsh, J., Warren, J., Lukas, R., Collin, J. G., and Berg, R. R. (2006a). “Ground Improvement Methods”- Volume I. Federal Highway Administration Publication No. NHI-06-020.
Lukas, R.G. (1986). “Dynamic Compaction for Highway Construction Volume I: Design and Construction Guidelines.” U.S. Department of Transportation, Federal Highway Administration, Washington, D.C., FHWA/RD-86/133.
Lukas, R.G. (1995). “Dynamic Compaction – Geotechnical Engineering Circular No. 1”, U.S. Department of Transportation, Federal Highway Administration, Washington, D.C., FHWA-SA-95-037.
Terashi, M. and Juran, I. (2000). “Ground Improvement – State of the Art.” Proceedings of GeoEng 2000, An International Conference on Geotechnical & Geological Engineering, 10-24 November 2000, Melbourne, Australia, Volume 1, pp. 461-519.
Youd, T.L., Idriss, I.M., Andrus, R.D., Arango. I., Castro, G., Christian, J.T., Dobry, R., Finn, W.D.L., Harder, L.F., Hynes, M.E., Ishihara, K., Koester, J.P., Liao, S.S.C., Marcuson, W.F., Martin, G.R., Mitchell, J.K., Moriwaki, Y., Power, M.S., Robertson, P.K., Seed, R.B., and Stokoe, K.H. (2001). “Liquefaction Resistance of Soils: Summary Report from the 1996 NCEER and 1998 NCEER/NSF Workshops on Evaluation of Liquefaction Resistance of Soils”, J. of Geotechnical and Geoenvironmental Engineering, ASCE, Vol. 127, No. 10, pp. 817 - 833.
- Owing to the lack of precision and uncertainties associated with shear wave velocity - liquefaction correlations, this method is not considered further herein.
Summary of Design/Analysis Procedure: FHWA Design Circular Method
Current FHWA Reference:
Lukas (1995)
Supporting Reference(s):
Dumas and Beaton (1992)
Elias et al. (2006)
Lukas (1996)
Terashi and Juran (2000)
A detailed technical workplan for deep dynamic compaction includes:
- The tamper weight and drop height
- The average amount of energy that needs to be applied over the area to be treated
- The area that needs to be compacted
- The spacing between each drop location
- The number of drops at each location
- The number of passes with which the drops will be completed
- Working platform requirements for the equipment
- What vibration controls may be required
- Vibration monitoring requirements
Table 6 in Lukas (1995) provides a summary of each parameter and how it can be determined. To be clear, “phase” refers to the high or low energy phase, “pass” refers to one complete pass over the entire site within one phase, and a “series” is a set of continuous drops on one grid point within one pass. A low energy, or ironing, phase may be necessary to compact the upper soil layers disturbed by the high energy phase and subsequent leveling earthwork. Multiple passes (compacting every second or third grid point) may be necessary to allow excess pore pressures to dissipate between passes or if crater depths become too excessive.
The weight of the tamper and the drop height are based on the depth of the layer that needs to be improved. The equation used is:
D = 1.7*n*(W*H)0.5
where,
D = thickness of the layer to be improved in meters
n = empirical constant based on soil type which generally ranges between 0.3 and 0.6
W = weight of the tamper in Mg (tonnes)
H = tamper drop height in meters
TABLE 1. RECOMMENDED n VALUE FOR DIFFERENT SOIL TYPES (LUKAS 1995)
| Soil Type | Degree of Saturation | Recommended n Value* |
|---|---|---|
| Pervious Soil Deposits Granular soils |
High | 0.5 |
| Pervious Soil Deposits Granular soils |
Low | 0.5 – 0.6 |
| Semipervious Soil Deposits Primarily silts with plasticity index of <8 |
High | 0.35 – 0.4 |
| Semipervious Soil Deposits Primarily silts with plasticity index of <8 |
Low | 0.4 – 0.5 |
| Impervious Deposits Primarily clayey soils with plasticity index of >8 |
High | Not recommended |
| Impervious Deposits Primarily clayey soils with plasticity index of >8 |
Low | 0.35 – 0.40 Soils should be at water content less than the plastic limit. |
*For an applied energy of 1 to 3 MJ/m2 and for a tamper drop using a single cable with a free spool drum.
The amount of energy needed across the entire site to achieve the required improvement is based on the soil type and density, the depth of the compaction required and the amount of improvement needed. The amount of energy per unit area applied by the tamper is based on the number of drops in a single location, the height of the drop and the weight of the tamper. The equation used is:
Applied Energy = (Tamper Weight) * (Tamper Height) * (# of Drops) * (# of Passes)(Grid Spacing) * (Grid Spacing)
where,
W = weight of the tamper in Megagrams (tonnes)
H = drop height in meters
P = number of passes used
N = number of drops at a single location
Another way to calculate the applied energy is to use the preliminary energy figures based on soil type found in Table 8 of Lukas (1995), reproduced below as Table 2. These values account for soil type and initial relative density. The average energy per unit area is then found by multiplying the number in Table 2 by the thickness of the layer to be improved. The energy applied is adjusted in the field to achieve the required amount of soil improvement after preliminary soil improvement results have been determined from field testing.
TABLE 2. APPLIED ENERGY GUIDELINES (LUKAS 1995).
| Soil Type | Degree of Saturation | Recommended n Value* |
|---|---|---|
| Pervious coarse-grained soil - Zone 1 of Figure 5 | 200 – 250 | 33 – 41 |
| Semipervious fine-grained soils - Zone 2 and clay fills above the water table - Zone 3 of Figure 5 | 250 – 350 | 41 – 60 |
| Landfills | 600 – 1100 | 100 – 180 |
Note: Standard Proctor energy equals 600 kJ/m3.
The number of drops required at each location can be calculated from the applied energy equation shown above using the assumption that only one pass is needed. Generally, 5 to 12 drops are required in a single location. If fewer than 5 drops are needed, then the grid spacing may be too small. Multiple passes may be required if the impact crater becomes too deep. Tampers are hard to remove from deep craters, which may cave in. The crater depth should be limited to 1 ½ to 2 times the height of the tamper. Usually, the number of drops is determined as the initial phase of compaction is being carried out, based on the observed ground response.
The spacing between the drop points usually ranges from 1 ½ to 2 ½ times the effective diameter or width of the tamper. Where porewater pressures may require additional time to dissipate, the compaction can be staged by performing the compaction at every second or third drop location, allowing the porewater pressure to dissipate before starting another pass at the intermediate drop locations. Alternatively, the dissipation of excess porewater pressure can be accelerated by installation of prefabricated vertical drains (PVD) throughout the area to be treated prior to commencing the DDC.
Liquefaction Potential Assessment
DDC may be used at sites with in-situ soils that may be susceptible to liquefaction during earthquakes. Saturated sands, silty sands, sandy silts, and silts are likely to be in this category. When DDC is used to densify soils for the support of embankments and structures, it is also necessary to confirm that there is not also a risk of liquefaction or other ground disturbance during a seismic event that could lead to loss of support and lateral spreading. The initial assessment of whether the soil at a site will liquefy in an earthquake is made in terms of whether the in-situ shear strength under cyclic loading, represented as a Cyclic Resistance Ratio (CRR), is less than the cyclic shear stress that will cause liquefaction, termed the Cyclic Stress Ratio (CSR).
CSR and strength of the soil layer, usually determined in-situ by means of penetration tests and shear wave velocity1 measurements, have been developed that define the boundary between liquefaction and no liquefaction over a range of peak ground motion accelerations. This boundary has been determined through extensive analyses of case history data from many earthquakes. Standard Penetration Tests (SPT), Cone Penetration Tests (CPT), and Becker Penetration Tests (BPT) for soils containing gravel and cobbles are used to determine the CRR. Values of CRR are defined by the points on the boundary curve that separate liquefaction and no liquefaction zones on a plot of CSR vs. penetration resistance or shear wave velocity corresponding to the measured and corrected in-situ property. An example of such a plot for liquefaction analysis using the SPT is shown in Figure 1.
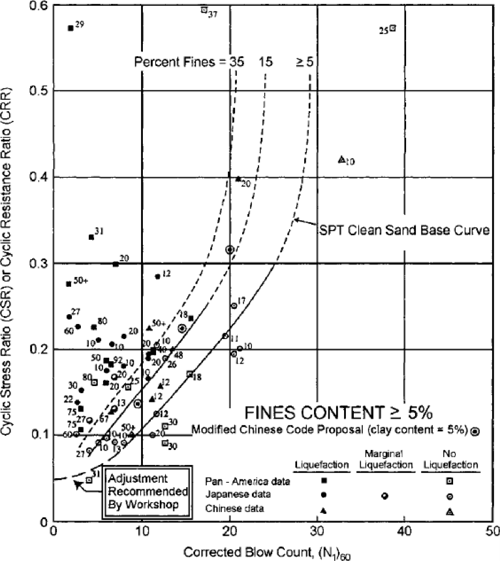
Although straightforward in concept, the liquefaction potential analysis is complex in application, because (1) the CSR depends on the input motions within the soil layer which, in turn, depend on such factors as earthquake magnitude and intensity, distance from the epicenter, geologic setting, rock conditions, and soil profile characteristics, (2) the CRR depends on such factors as overburden stress, fines content of the soil, and static shear stress, and (3) determination of normalized values of the penetration resistance involves several corrections to the measured values, especially in the case of the SPT.
Information about input ground motions can be obtained from local experience and recorded ground motions near the site, if available, or from seismicity information obtainable from the:
- United States Geological Survey Ground Motion Calculator (https://www.usgs.gov/programs/earthquake-hazards/design-ground-motions), which can be used to obtain peak rock accelerations for the site.
- USGS Earthquakes Hazards Program website (https://www.usgs.gov/programs/earthquake-hazards/hazards), which provides design ground motions for buildings and bridges; interactive fault maps; scenarios of ground motions and effects of specific hypothetical large earthquakes; and seismic hazard maps and site-specific data which includes a Beta version of a unified hazard tool that enables determination of site-specific ground motion parameters.
Widely used liquefaction correlation diagrams for SPT and CPT, along with discussions of how to make the necessary computations to obtain the CSR, (N1)60, qc1N, and the CRR are given in Youd, et al. (2001) and Boulanger and Idriss (2014).
The usual design procedure for ground improvement to prevent liquefaction using DDC is to require that the soil be densified sufficiently to attain a factor of safety against liquefaction triggering, defined by CRR/CSR, greater than 1.5, with a minimum of 1.3, although no single value may be suitable for all conditions owing to the many factors that influence each specific site and problem. Each case needs to be judged on its own merit in the event there are a few points where the safety factor criteria are not met. A few scattered locations where the safety factor is below the minimum is quite different from several low values that are grouped closely together. If a value fails by a large amount it is more significant than if it fails to meet the minimum by a small amount, etc.
1 Owing to the lack of precision and uncertainties associated with shear wave velocity - liquefaction correlations, this method is not considered further herein.